Introduction
Just like Studio has a log file to help diagnose bugs, the JavaScript debugger has an error log that you can access through Firefox or IE. If you think you find a bug in the debugger, you can post the log contents to the forums to help the support team troubleshoot the issue.
Instructions
You will need to have installed the debugger into your browser to be able to access your log. See Installing the JavaScript debugger or Installing the Internet Explorer debugger for installation help.
Accessing the Firefox debugger log
To access your Firefox debugger log:
- In Firefox, select Extensions (called Add-ons in some Firefox configurations) from the Tools menu to open an Extensions pop-up window.
- In the Extensions pop-up window, select the Aptana Debugger Service.
- Click the Options button to open an Aptana Studio Debugger Preferences pop-up window.
- To the right of the path for the Error Log, click the View button to display the Error Log.
- or -
- In Firefox, click on the Aptana logo on Firefox status bar, choose "About Aptana Studio..." menu item.
- Click the Preferences button to open an Aptana Debugger Preferences pop-up window.
- To the right of the path for the Error Log, click the View button to display the Error Log.
Accessing the Internet Explorer debugger log
To access your IE debugger log:
- Start IE.
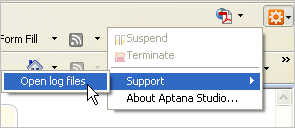
- Click the Aptana button
 , and select Support > Open log files (shown below) to open your log files.
The IE debugger opens your log file(s) in a text editor.