Android developers can debug using Chrome DevTools with Titanium SDK 7.0.x and later. Searching for iOS Debugging? Here you go!
Debugging with Chrome DevTools
-
Launch the app/build on the device or a simulator. Note: if using a device, make sure that it is connected by an USB cable before debugging. If you encounter any issues with device discoverability, please ensure that the USB cable is directly connected, not through a USB hub.
Sample via command-line:
appc run -p android --debug-host /127.0.0.1:51388
- Launch Chrome. Note you should be signed into Chrome. Also noteworthy, debugging may not work in Incognito or Guest modes
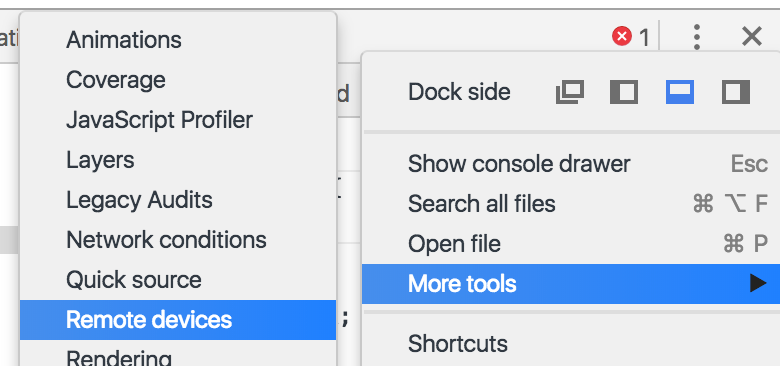
- Open DevTools by going to More Tools > Developer Tools from Chrome's Main Menu.
- For devices:
- From the Main Menu (the three vertical dots in the far right corner), select More Tools > Remote devices.
- In DevTools, click the Settings tab if another tab is showing.
- Ensure that Discover USB devices is enabled.
- For simulators:
- After building, the console will log the required debugger information, e.g.
[WARN] JSDebugger: (main) [13,555] Debugger listening on ws://127.0.0.1:51388/6b8d130f-5a6c-7623-a760-ffc319010448[WARN] JSDebugger: (main) [1,556] To connect Chrome DevTools, open Chrome to chrome-devtools://devtools/bundled/inspector.html?experiments=true&v8only=true&ws=127.0.0.1:51388/6b8d130f-5a6c-7623-a760-ffc319010448 |
Refer to Google's Get Started with Remote Debugging Android Devices tutorial for further details on how to debug with Chrome DevTools.
Sample build and debug
The following is a sample build and debug information to test out your debugging routine on Chrome.
|
1
2
3
|
appc new -t titanium -p android -n inspector --id com.axway.debugger.test -u http://www.example.comcd inspectorappc run -p android --debug-host /127.0.0.1:51388 |
Once the app launches, it should stay on the "splash screen"
and spit out some logs that it's waiting 60 seconds for the debugger as
well as details on how to connect to it. Specifically it should spit out
a URL you can open in Google Chrome browser to debug the app. The debugger
should "pause" on the very first line of app.js.
You should be able to hit any breakpoint in app.js even on the first line.