Metrics Overview
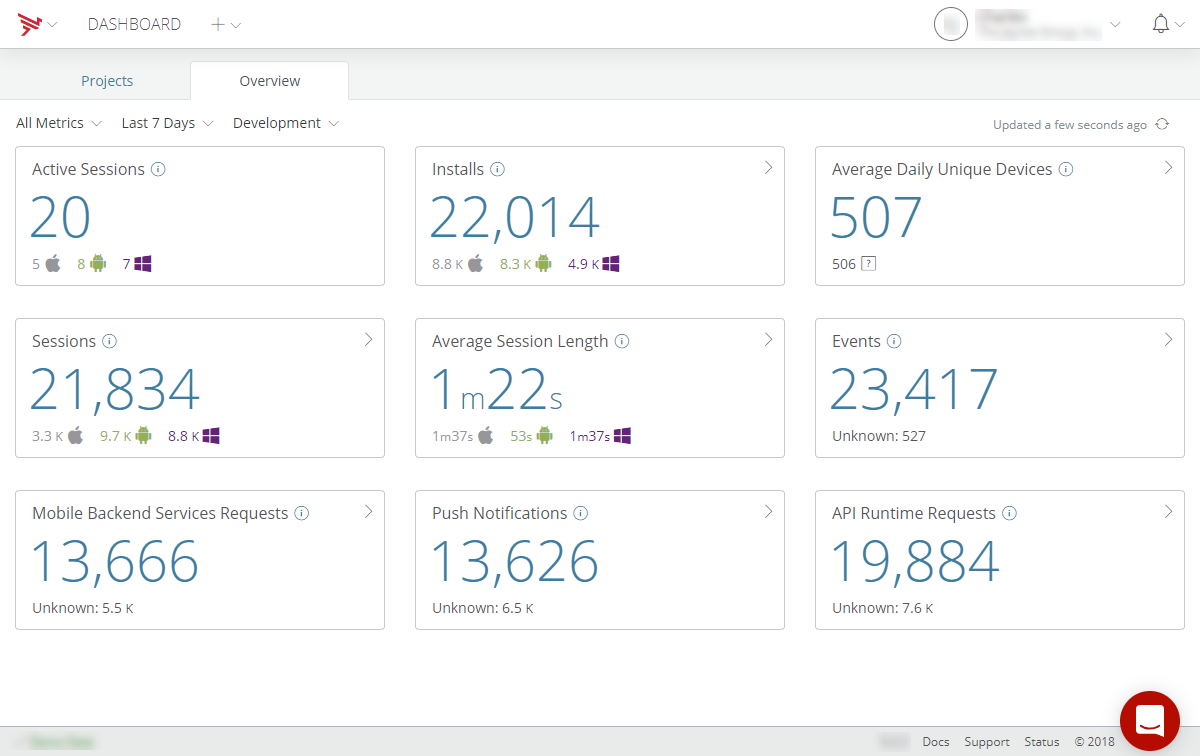
To access the Metrics Overview screen, select the Overview tab on the Dashboard home screen. The Metrics Overview screen displays several key metrics from the Analytics, Cloud, Performance, and Test services. These metrics aggregate data from all applications, deployment environments, and versions. Select a metric to open a details page for that metric or select a metric from the Metrics drop-menu to view details of the selected metric.
The following metrics are displayed:
- Active Sessions - Number of users in your applications at the moment.
- Installs – Total installs of your applications during the provided time range.
- Average Daily Unique Devices - Average daily unique devices using your applications during the provided time range.
- Sessions – Total number of user sessions for your applications during the provided time range.
- Average Session Length - Average length of use of your applications during the provided time range.
- Events - Total number of events generated by your applications during the provided time range.
- Mobile Backend Services Requests – The total number of Mobile Backend Services requests made during the provided time range.
- Push Notifications – Total number of push notifications sent during the provided time range.
- API Runtime Requests - Total number of API Runtime requests made during the provided time range.
The displayed metrics can be filtered by the selected time period and environment. For information on selecting a time period or setting a custom time period, refer to the Data Filter section of Viewing Analytics.
The Metrics drop-menu includes the following selections:
- All Metrics - Displays the overview of several key metrics.
- API Runtime Requests - Displays detailed API Runtime requests metrics.
- Avg. Session Length - Displays detailed average session length metrics.
- Unique Devices - Displays detailed unique devices metrics.
- Installs - Displays detailed metric information or installations.
- Events - Displays detailed event metrics.
- Mobile Backend Service Requests - Displays detailed MBS requests metrics.
- Push Notifications - Displays detailed push notifications metrics.
- Sessions - Displays detailed sessions metrics.
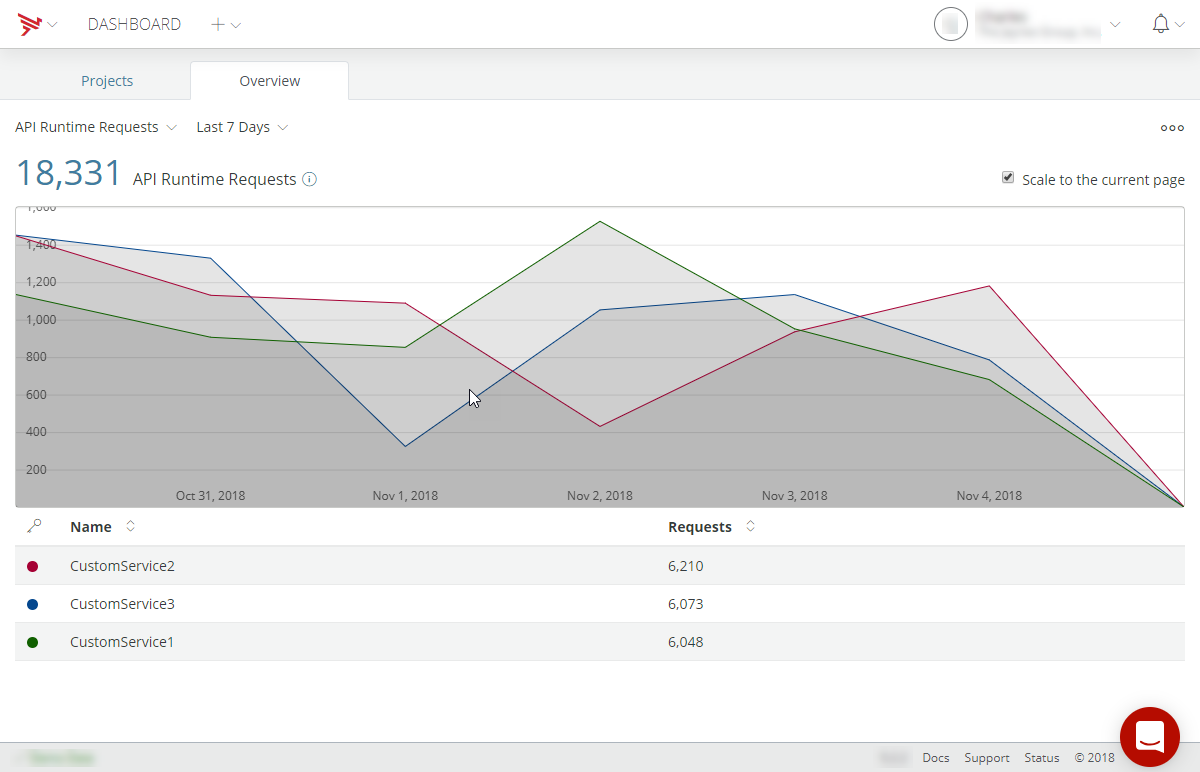
API Runtime Requests
The API Runtime Requests selection displays detailed metrics for API runtime requests for the selected time period. The total number of API Runtime requests made during the provided time range is also displayed. To toggle on and off displayed metrics information in the chart, click the on the item in the table legend. Additionally, the API runtime requests metrics can be exported for use in other programs. For details on exporting the API runtime requests metrics, refer to the Export Data section of Viewing Analytics. To scale the metrics display to the current page, select Scale to the current page.
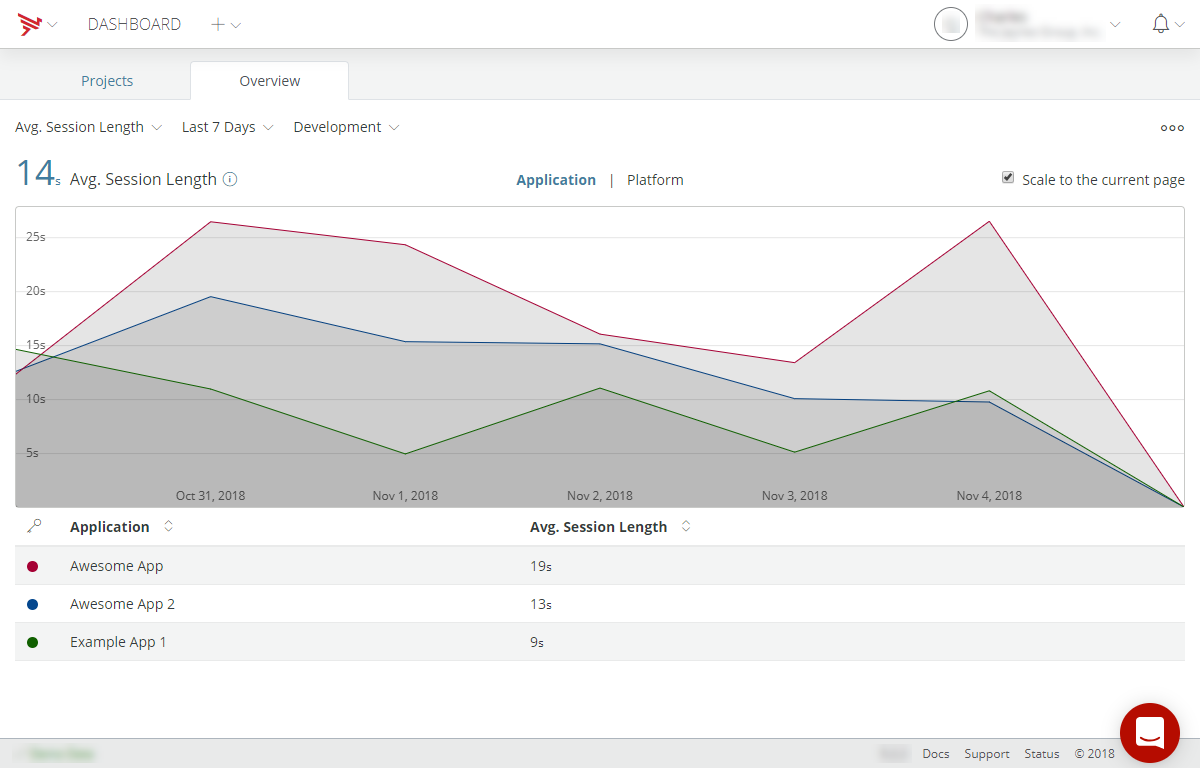
Avg. Session Length
The Avg. Session Length selection displays detailed metrics on the average session length either by application or by platform for the selected time period, version, and environment. The average length of use of your applications during the provided time range is also displayed. To toggle on and off displayed metrics information in the chart, click the on the item in the table legend. Additionally, the average session length metrics can be exported for use in other programs. For details on exporting the average session length metrics, refer to the Export Data section of Viewing Analytics. To scale the metrics display to the current page, select Scale to the current page.
Unique Devices
The Unique Devices selection displays detailed metrics on maximum daily unique devices using your applications for the selected time period and environment. To toggle on and off displayed metrics information in the chart, click the on the item in the table legend. Additionally, the maximum number of unique devices metrics can be exported for use in other programs. For details on exporting the maximum number of unique devices metrics, refer to the Export Data section of Viewing Analytics. To scale the metrics display to the current page, select Scale to the current page.

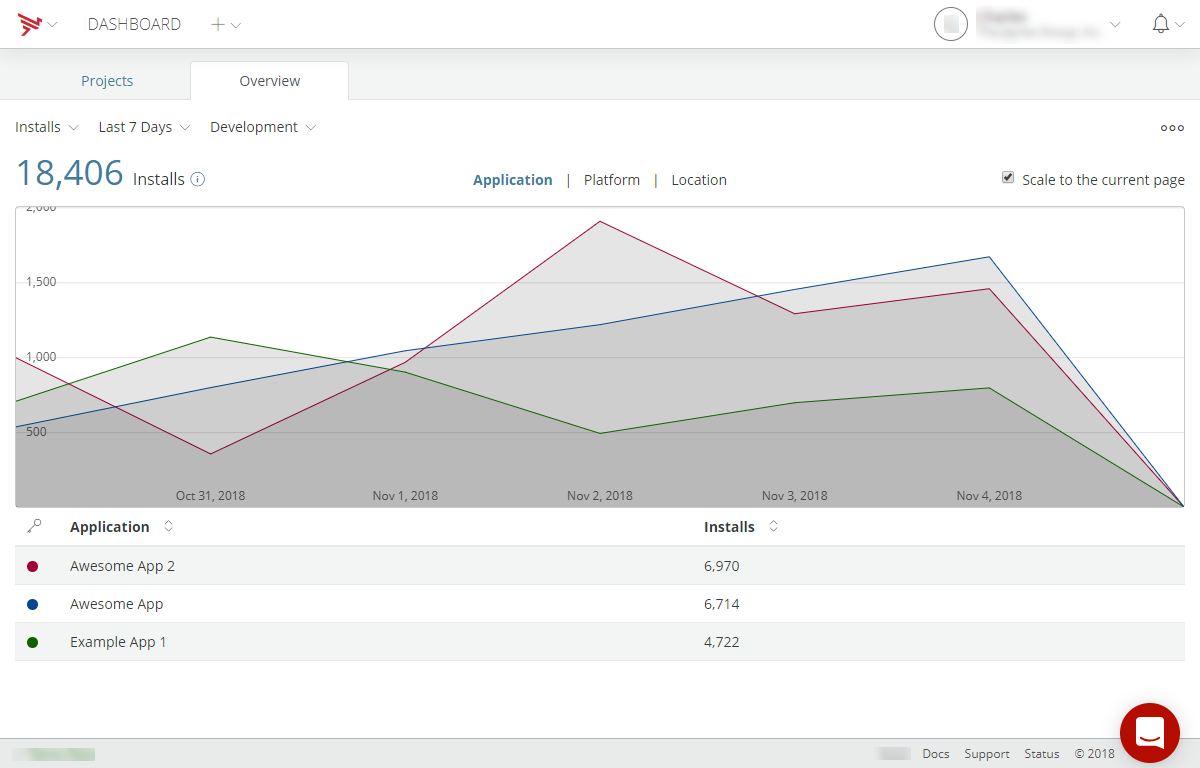
Installs
The Installs selection displays detailed metrics of the total number of installs of your applications during the provided time range either by application, by platform, or by geographic location for the selected time period and environment. The total number of all installations is also displayed. To toggle on and off displayed metrics information in the chart, click the on the item in the table legend. Additionally, the number of installations metrics can be exported for use in other programs. For details on exporting the number of installations metrics, refer to the Export Data section of Viewing Analytics. To scale the metrics display to the current page, select Scale to the current page.
Events
The Events selection displays detailed metrics for event occurrences for the selected time period and environment either by application or by event name. The total number of events is also displayed. To toggle on and off displayed metrics information in the chart, click the on the item in the table legend. Additionally, the number of event occurrences metrics can be exported for use in other programs. For details on exporting the number of event occurrences metrics, refer to the Export Data section of Viewing Analytics. To scale the metrics display to the current page, select Scale to the current page.

Mobile Backend Service Requests
The Mobile Backend Service Requests selection displays detailed metrics for the Mobile Backend Services requests either by application or by application type for the selected time period and environment. The total number of Mobile Backend Service requests is also displayed. To toggle on and off displayed metrics information in the chart, click the on the item in the table legend. Additionally, the MBS request metrics can be exported for use in other programs. For details on exporting the MBS request metrics, refer to the Export Data section of Viewing Analytics. To scale the metrics display to the current page, select Scale to the current page.

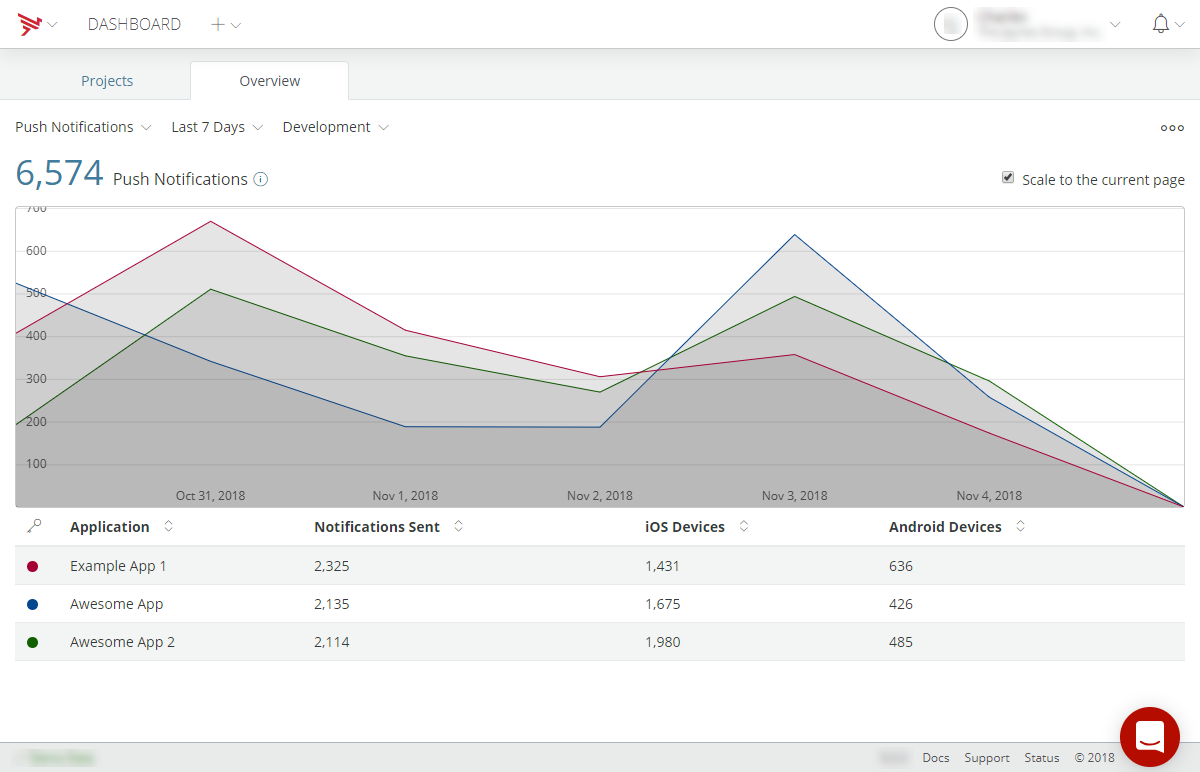
Push Notifications
The Push Notifications selection displays detailed metrics for push notifications for the selected time period and environment. The total number of push notifications is also displayed. To toggle on and off displayed metrics information in the chart, click the on the item in the table legend. Additionally, the push notifications metrics can be exported for use in other programs. For details on exporting the push notifications metrics, refer to the Export Data section of Viewing Analytics. To scale the metrics display to the current page, select Scale to the current page.
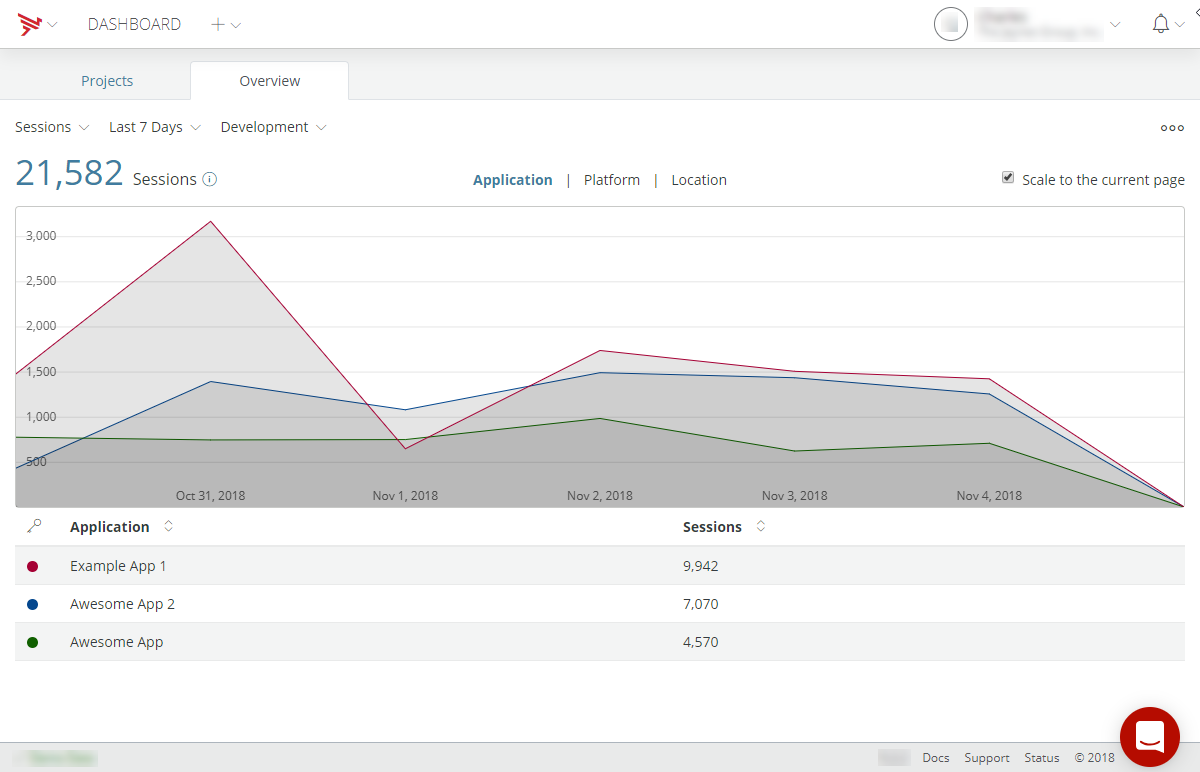
Sessions
The Sessions selection displays the total number of user sessions for your applications either by application, by platform, or by geographic location for the selected time period and environment. The total number of session is also displayed. To toggle on and off displayed metrics information in the chart, click the on the item in the table legend. Additionally, the sessions metrics can be exported for use in other programs. For details on exporting the sessions metrics, refer to the Export Data section of Viewing Analytics. To scale the metrics display to the current page, select Scale to the current page.