Contents |
What
 >
>
Alerts for a variety of events can be set on the Notification Preferences
screen. The notification preferences apply to all sites associated with your Aptana Cloud account. Aptana Cloud will also alert
you to information through the Message Center, but using this screen you can customize which alerts you receive in the
message center.
How
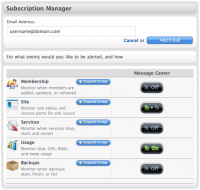
Add an Email
To add an email address to be notified, click the add new email button. Enter an email address, and click the add email button.
After you've added an email, you can customize which alerts are sent to that address.
After you've added an email, you can customize which alerts are sent to that address.
Remove Email
To remove an email address, scroll to the bottom of the column under the
address you want to remove, and click the remove email button.
Customize Alerts
To activate or deactivate alerts, expand the group you wish to customize
alerts for by clicking the expand group button. Within the group you will see the name and brief description of
the alert. Next to that will be an on/off toggle button.
Available Alerts
You can set alerts in five areas:
- Membership - Monitor when members are added, updated, or removed.
- Site - Monitor site status and receive alerts for site issues.
- Services - Monitor when services stop, start, and restart.
- Usage - Monitor disk, CPU, RAM, and swap usage
- Backups
Alert Details
Membership
- Membership Added - Someone has been added to the team.
- Membership Removed - Someone has been removed from the team.
- Membership Updated - Someone's membership has been updated, e.g. their role has changed.
Site
- Site Created - A new site has been created.
- Site Deleted - The site has been deleted.
- Site Rebooted - The site has been rebooted (restarted).
- Site Suspended - The site has been suspended, is not running, and cannot be accessed.
- Site Unsuspended - The site is no longer suspended.
- Site Down - The site is not running, or not running properly.
- Site Synced - One or more files on the site have been synchronised with Aptana.
- Site Unresponsive - The site is not responding and may be down - we are automatically trying to restart it.
- Site Responsive - The site is responding once again.
Services
- Service Restarted - One of your services, such as the web server or Jaxer, has been restarted.
- Service Started - One of your services, such as the web server or Jaxer, has been started.
- Service Stopped - One of your services, such as the web server or Jaxer, has been stopped.
- Service Upgrade Successful - One of your services, such as the web server or Jaxer, has been upgraded successfully to a more up to date version.
- Service In Error - The service has gone into an error state and is down.
Usage
- CPU Usage Threshold - Your site has exceeded its CPU (processor) usage threshold. If this persists, you may need to change your site or application to make it more efficient, or upgrade your plan.
- RAM Usage Threshold - Your site has exceeded its RAM (memory) usage threshold. If this persists, you may need to change your site or application to make it more efficient, or upgrade your plan.
- Swap Usage Threshold - Your site has exceeded its swap space usage threshold. If this persists, you may need to change your site or application to make it more efficient, or upgrade your plan.
- Disk Usage Threshold - Your site has exceeded its disk (storage) usage threshold. If this persists, you may need to change your site or application to make it more efficient, or upgrade your plan.
Backups
- Backup Available - A backup of your files and data has been created and is now available.
- Backup Failure - A backup of your files and data has been attempted and has failed. If this persists, please contact support to prevent potential loss of your files and data.
Getting to My Account - My Profile
- choose Open Aptana Home from the Help menu
- click the 'My Account tab
- the my profile tab in the sub navigation will be selected
- click the alert subscriptions tab
