Introduction
AMPLIFY Appcelerator Analytics collects real-time data about your application's usage, which can then be viewed in the Analytics dashboard. By default, the Analytics dashboard provides information about app installs, the number of sessions, and average app session length (organized by app name, platform, and geography). Your app can also utilize custom analytic events and event funnels.
For platform-specific details about how analytics captured, see Analytics Architecture.
For information about viewing analytics data, see Managing Client Applications.
Terminology
Analytics refers to data about how your application has been used, as well as information about how users interact with your application. Analytics data is transmitted in the form of events.
Events are operational milestones in the application. Some events are generated automatically, such as those that mark an installation, or the beginning and end of a session. Others may be custom events, which have a meaning specific to an application, such as tapping a specific button or opening a certain window.
A feature event represents an action a user could take in an application, such as 'liking an item' or launching a video'. Applications use the Titanium or APSAnalytics API to create custom events.
Event funnels let you define custom, ordered event sequences that let you track a specific user process, such as finding a product and making a purchase.
The Analytics dashboard organizes, analyzes, and presents analytics data captured for your applications. You also use the Analytics dashboard to create and view event funnels.
Getting started with Analytics
Enabling analytics is enabled by default when creating a project using
Axway Appcelerator Studio (Studio). If for some reason, it's not enabled, you can enable Axway Appcelerator Platform Services in the project's tiapp.xml and deploy your application.
To enable analytics in a new Appcelerator project:
- In Studio, create a new Mobile Application (File > New Mobile App Project...).
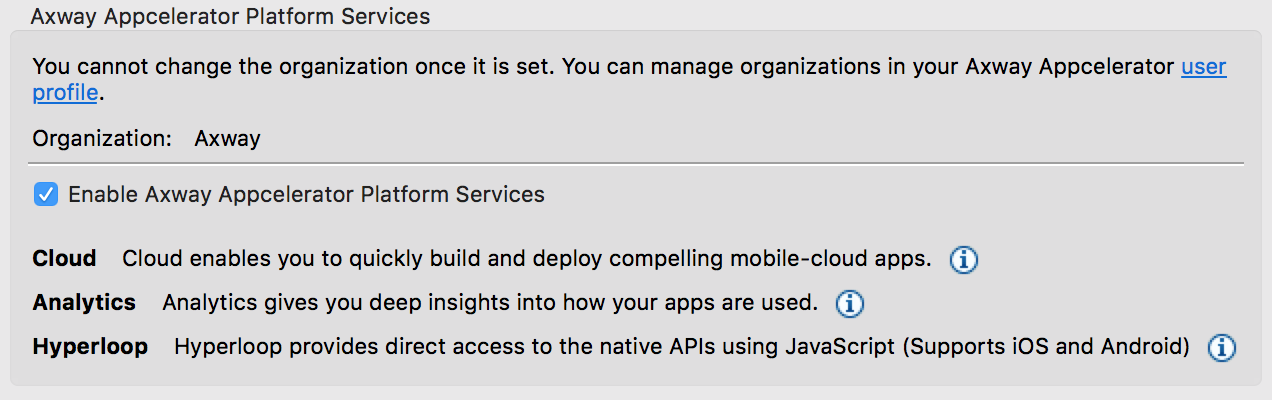
- Make sure the Enable Axway Appcelerator Platform Services option is enabled in the New Mobile App Project dialog, and select
the appropriate organization from the Organization pop-up menu. The application
is tied to the account and organization used to create it.
- Enter the rest of the required project information and click Finish.
- Build your application and deploy it to devices to begin collecting analytics data.
Next steps
- Once deployed, you can begin to view data captured for your application in the Analytics dashboard
- Use custom events to track basic usage and navigation patterns
- Create event funnels to analyze a specific process better
Creating custom events
The Titanium.Analytics API can be used to send custom events and data, called feature events.
Feature events
Titanium.Analytics.featureEvent(name, data) is used to send a feature event. A feature event can be used to represent a user action, application state, or send a data payload.
Feature event names should be as generic as possible and without spaces (for example, "home_window.open" instead of "Home Window Open"). This allows events to be easily consolidated and queried from Dashboard.
User actions can be logged using feature events; here's an example of logging a user opening the home window of an app.
|
1
2
3
4
5
6
|
// Detect when home window is opened.home_window.addEventListener('open', e => { // Send analytics feature event to log user action. Ti.Analytics.featureEvent('home_window.open'); ...}); |
In some cases, additional data can also be sent, which can be queried on Dashboard. In this example, an analytics event is sent when the user backgrounds their app.
|
1
2
3
4
5
6
7
8
9
10
11
|
// Detect when application is backgrounded.Ti.App.addEventListener('paused', e => { // Send analytics feature event with payload. // In this example, the user may have added items to their shopping basket
but decided to exit the app. // We can log how many items were in the users basket and query this data
on Dashboard. Ti.Analytics.featureEvent('shopping_basket.backgrounded', { items: shopping_basket.count }); ...}); |
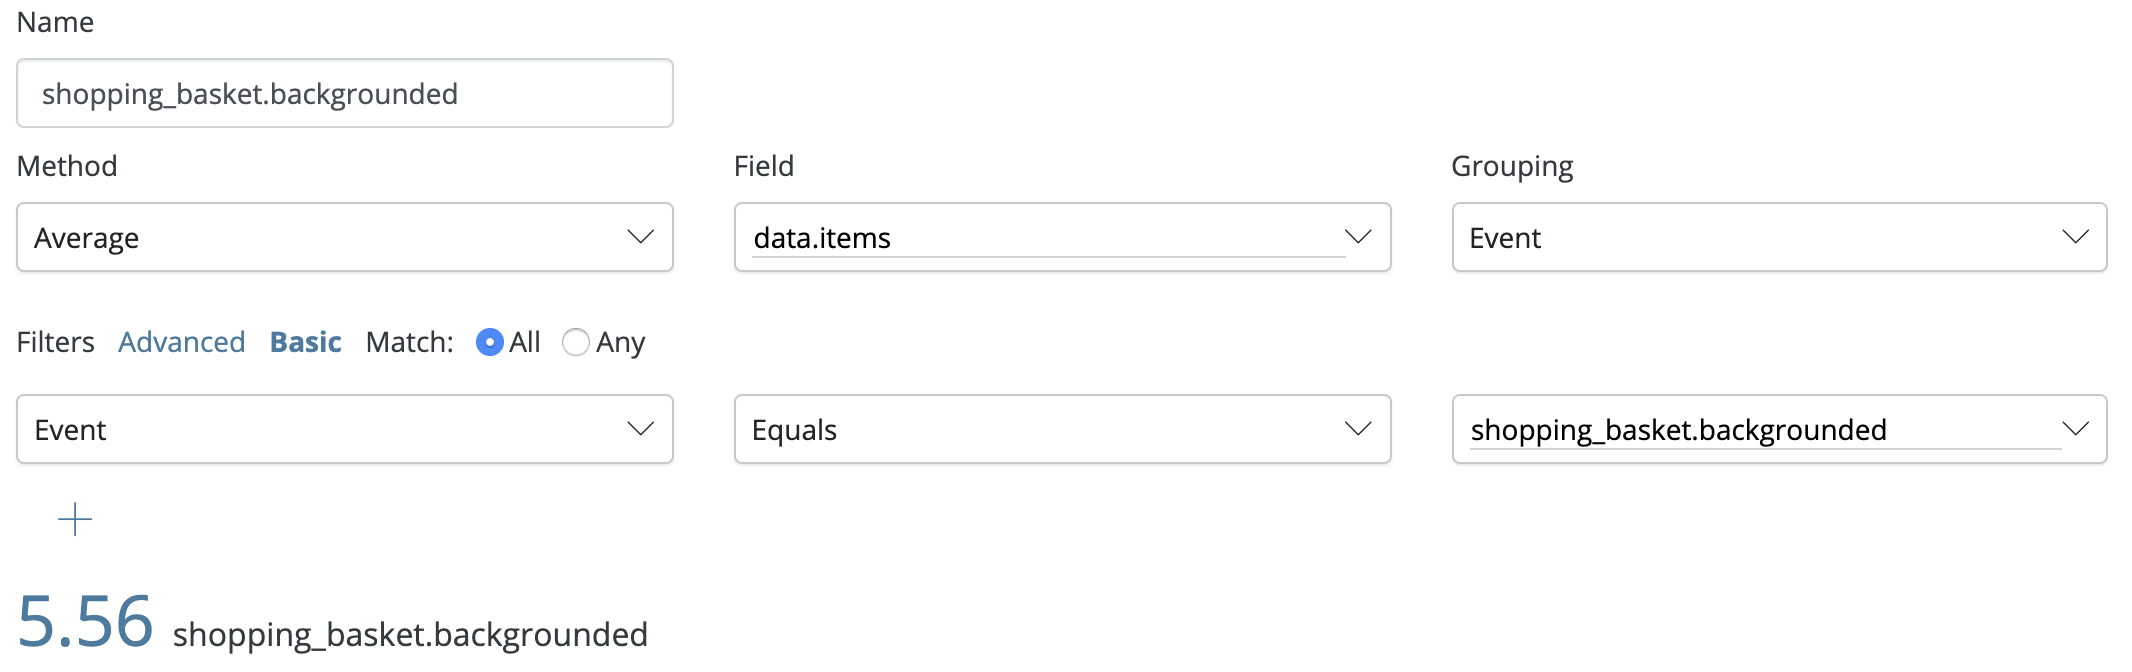
We can then create a custom query in Dashboard to calculate the average number of items users had in their basket upon backgrounding the application.
Creating and viewing event funnels
You use Dashboard to create and view event funnels. Using event funnels involves the following basic steps:
- Identify the process to track, such as a user sign-up, or product purchase flow.
- Identifying the custom events to be recorded and when they should be captured in the process.
- Instrumenting the custom events in your application, as described in Creating Custom Events.
- Deploying the application to devices and begin collecting custom event data. Until the application has been deployed to a device, simulator, or emulator, the custom events won't appear in Dashboard.
- Creating the event funnel in Dashboard (see Creating an Event Funnel).
Creating an event funnel
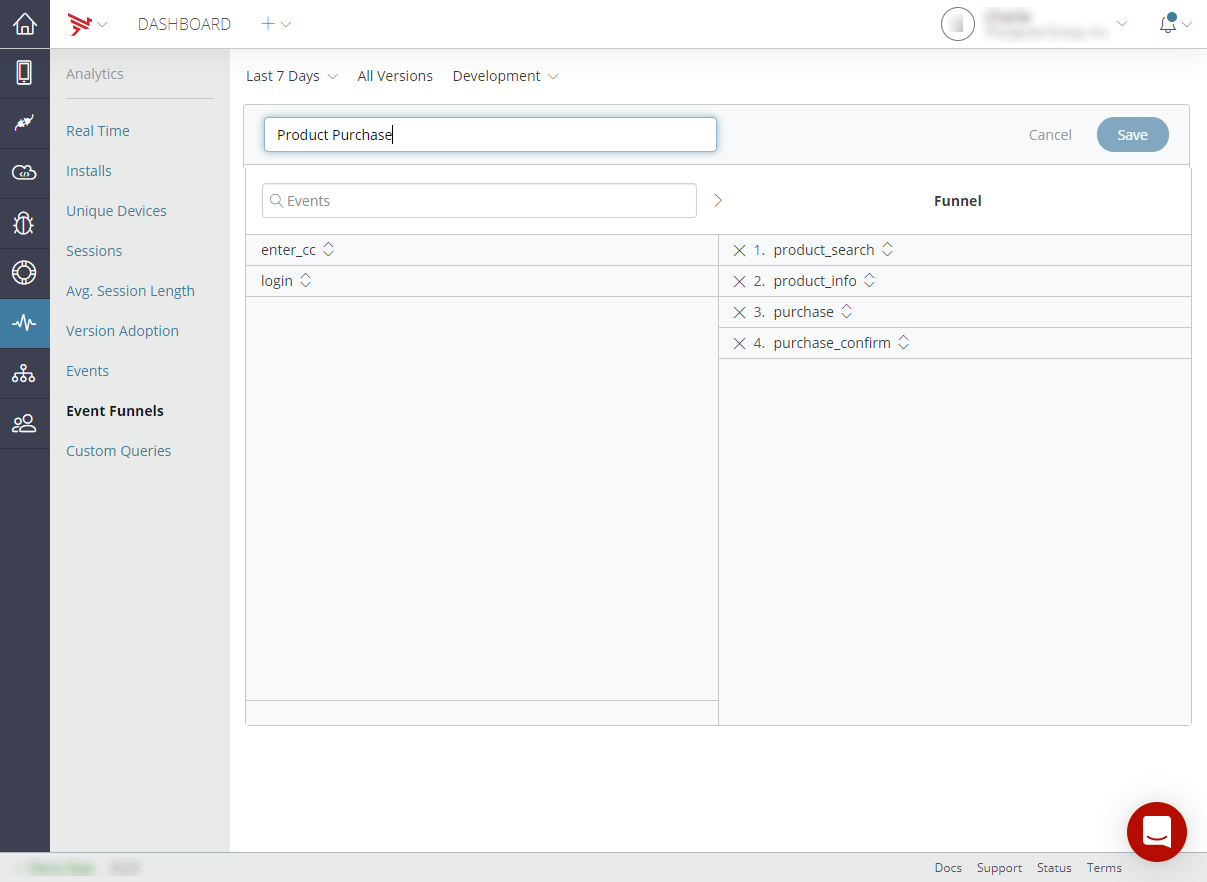
When you create an event funnel in Dashboard, you select the events you want to track, in the order that defines the process you want to track and analyze. For instance, in the following example, the user has created an event funnel named "Product Purchase" that tracks the progress of a retail customer through five basic phases: logging into the site, searching for products, reviewing product information, making a purchase, and confirming the purchase.
Note
- An event funnel must contain at least two events
To create an event funnel
- In the Analytics Dashboard, make sure your application is selected.
- Select Analytics from the left navigation menu.
- Select Event Funnels from the Analytics menu. Your application's current event funnels are displayed, if any, exist.
- Click the + button to create a new event funnel.
- Enter a name for your event funnel.
-
Drag two or more custom events from the left column to the right column. Enter the name of an event in the Custom Events text field to filter available events by name.
-
To re-order an event, drag its reorder control up or down in the event list. Keep in mind that the order of the events you include is significant in terms of how the event funnel data is analyzed and presented.
- Remove an event by clicking the 'X' next to its name.
-
Click Save to save the event funnel.
Viewing event funnels
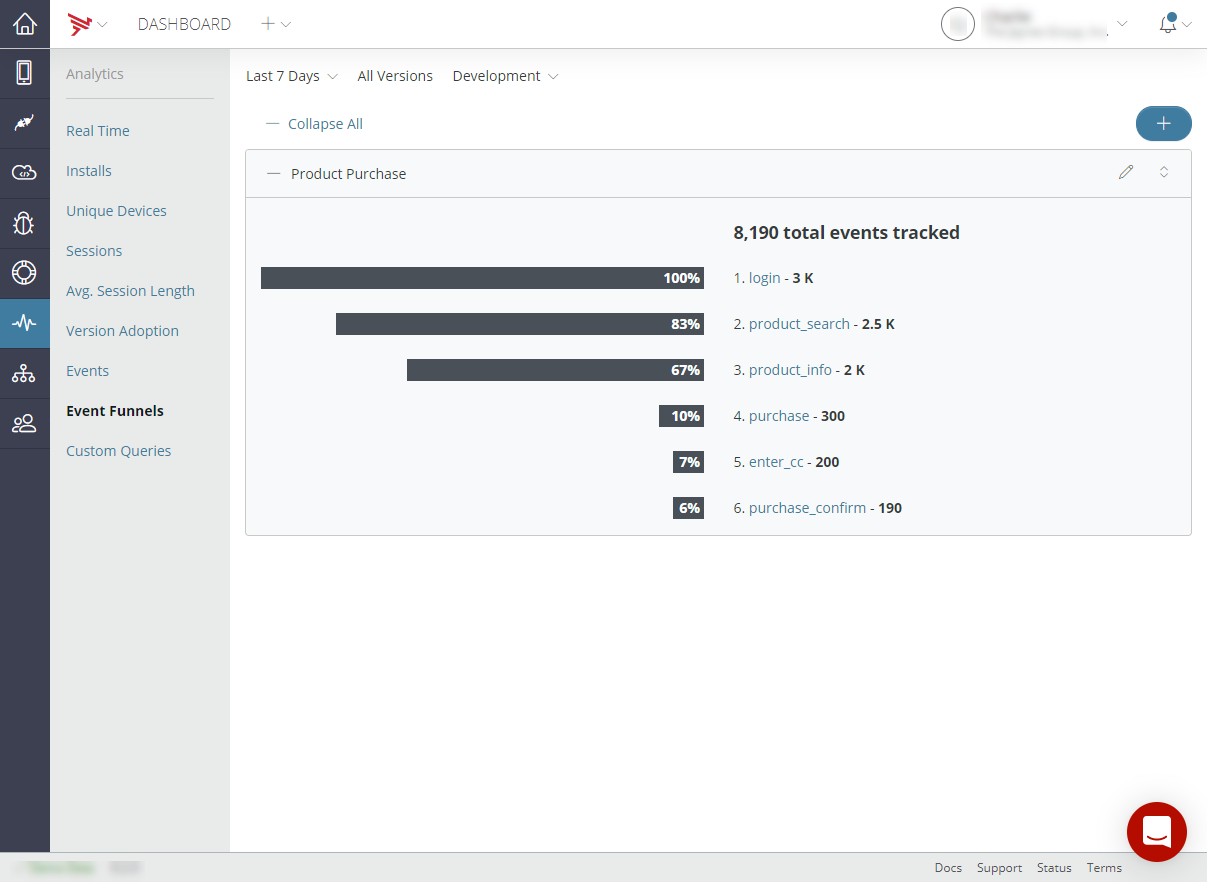
Once you've created an event funnel, you can begin analyzing the funnel results. The screenshot below shows the current results of the "Product Purchase" event funnel created above. As you can see, of all visitors to the home page, 83% of those searching for products, 67% of those who searched for products reviewed additional product information, and 10% of those who reviewed additional product information made a purchase.
To view an event funnel
- In the Analytics Dashboard, make sure your application is selected.
- Click Analytics in the left navigation menu.
- Click Event Funnels in the Analytics menu to view a list of your application's event funnels.
- To filter data by version, environment, or custom date range, use the drop-down lists located right below the main navigation bar.
To edit an event funnel
- In the Analytics Dashboard, make sure your application is selected.
- Click Analytics in the left navigation menu.
- Click Event Funnels in the Analytics menu to view a list of your event funnels.
- Locate the event funnel you want to edit, then click its Pencil icon in the top-right corner.
- From the edit screen you can:
- Move new custom events you want to track from the left column to the right column.
- Reorder events in the funnel.
- Remove events from the funnel by clicking the × next to the event.
- Rename the event funnel.
- Click Save to save your changes.
To remove an event funnel
- In the Analytics Dashboard, make sure your application is selected.
- Click Analytics in the left navigation menu.
- Click Event Funnels in the Analytics menu. This list your application's current event funnels.
- Locate the event funnel you want to remove, then click its Pencil icon in the top-right corner.
- Click Remove to delete the event funnel.
- A dialog appears asking to confirm the deletion. Click Continue.