This page explains how to install and start using the JavaScript debugger for Internet Explorer (IE).
Contents |
Introduction
When you upgrade to Aptana Studio Pro, you will gain access to the Aptana JavaScript debugger for Internet Explorer. The debugger for IE works the same as the JavaScript debugger for Firefox, but you will be able to debug your code for IE, also.
To learn more about upgrading to Aptana Studio Pro, see Upgrading to Aptana Studio Pro.
Instructions
- Open the file that you want to debug so that it is the active page in your Editor.
- From the Debug menu
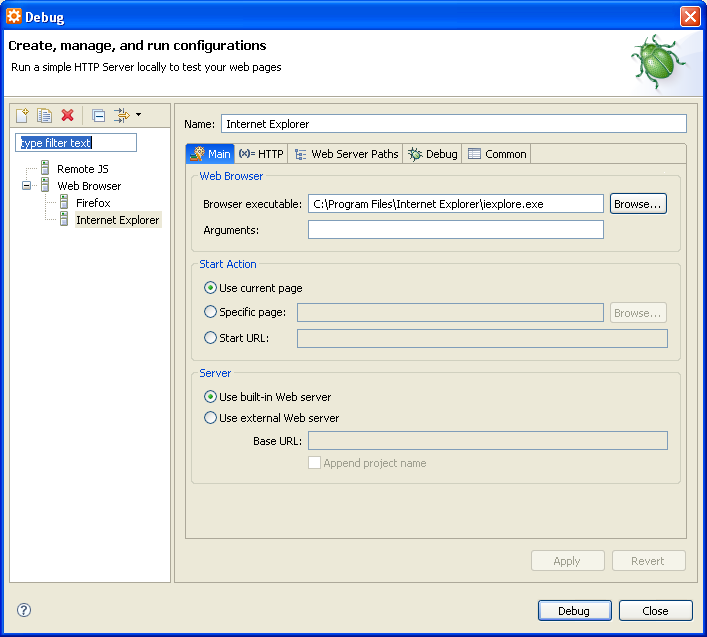
 , select Debug... to open a Debug window (shown below).

- If you do not already have a Web Browser configuration for IE, create a new one and point it to the location where IE is installed on your computer. (See Installing the JavaScript debugger for details.)
- In the lower-right corner of the window, click the Debug button and follow the prompts to install the IE debugger and start debugging your page.
Troubleshooting tips
If the IE debugger does not appear to be working, check the following Internet Explorer options.
Enabling the Aptana Debugger add-ons
You must have the Aptana Debugger add-ons enabled for the Aptana IE debugger to work.
To enable the add-ons:
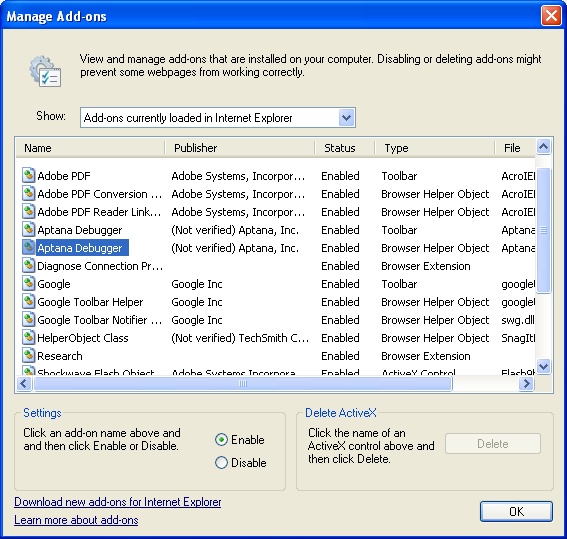
- In IE, select Manage Add-ons... from the Tools menu, and select Enable or Disable Add-ons... to open a Manage Add-ons window.
- Make sure that the two Aptana debugger plug-ins are enabled (shown below).
If not, select each plug-in and choose the Enable settings option.

Enabling script debugging
You must enable script debugging in your Internet Options in IE for the Aptana debugger to work properly.
To enable script debugging:
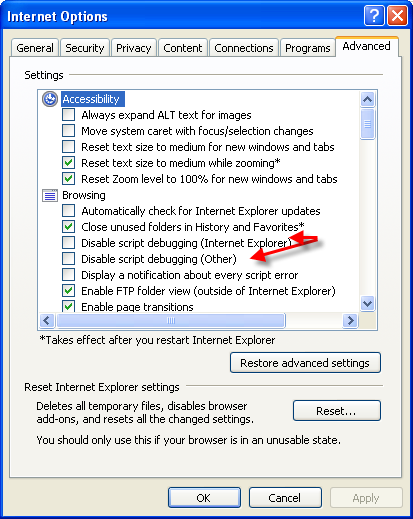
- In IE, select Internet Options from the Tools menu to open an Internet Options window.
- On the Internet Options window, click the Advanced tab.
- Under Browsing, make sure that the Disable script debugging (Internet Explorer) option is unchecked (shown below).

