
This page describes how to install the Aptana JavaScript debugger.
Introduction
Before you can debug your JavaScript code in Aptana, you will need to install the Aptana Debugger exension into your web browser. (Currently, the debugger is only available for Firefox. In the future, it will be available for IE and other web browsers.)
Note: If you are having trouble updating or installing the debugger and have an old version of the Aptana debugger installed, try uninstalling your old debugger before installing the new version. See Uninstalling the debugger for instructions.
Instructions
To install the debugger:
- Create a new Debug configuration for your web browser (Firefox).
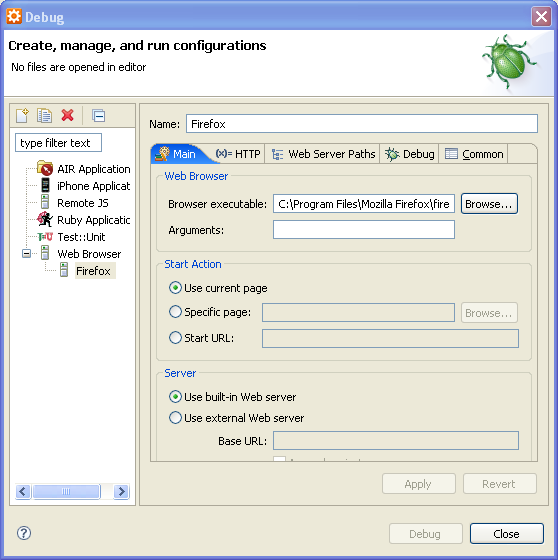
- From the Debug menu
 , select Debug... to open a Debug window (shown below).
- In the upper-left corner of the Debug window, in the toolbar, click the New Launch Configuration button
 to create a new configuration.
- In the Name field, type a name for your new configuration (e.g. "Firefox").
- Under Start Action, choose the option for the start page for the debugger. You can either use the current open page, browse to a specific file, or specify a URL.
- Under Server, unless you want to use an external web server, use the default choice
of the Built-in web server.
Note: Leave the Debug window open. In the next step, you will use the Debug window to install the debugger into your browser.
- From the Debug menu
- Install the debugger into your web browser.
- On the Debug window with your configuration set up, click the Debug button.
A browser window opens, checks for the Debugger extension, and then closes.
Aptana displays a prompt asking if you would like to install the Debugger Extension.
- Follow the instructions in the prompts to install the debugger into your browser.
- On the Debug window with your configuration set up, click the Debug button.
The debugger is now installed in your browser. To start debugging, return to the Aptana IDE and switch to the Debug perspective. See Running the debugger for more information.
Note: If you have trouble installing the debugger through Aptana, you can try installing it into Firefox through this URL: http://firefox.aptana.com/update/aptanadebugger.xpi .