
This Help topic gives an introduction to the Ruby Profiler Perspective that is included with the Pro version of Aptana RadRails.
Contents |
Introduction
RadRails 1.0 Pro includes a Profiling feature and plugin. This plugin adds a new Profiling perspective (shown below) that include new views that allow you to view CPU timing data and call graphs for launches of ruby applications.
Instructions
Installing the Ruby Profiler
The profiler plug-in is bundled with the ruby-prof gem, and you will be prompted to install this gem when you install the plug-in. (You can install this gem separately via the Rails Shell, RubyGems view, or command line.)
Professional plugins should be automatically checked for and download on restarts of Studio once your pro license is entered. You must have the standard version of the plugin first for it to check for the corresponding pro version. For example to get the RadRails Pro plugin, you must first install RadRails and have you pro license set up.
To manually install the profiler plugin:
- Go to Window > Preferences > Aptana > License.
- Click the Install... button in bottom right.
- An update dialog should appear allowing you to install any pro plugins that you do not currently have.
Running the Ruby profiler
To profile a ruby application, run the application under the profiler. To run the application under the profiler:
Right-click the file in the Ruby Editor or in the Ruby Explorer, and select Profile As > Ruby Application from the context menu (shown below).
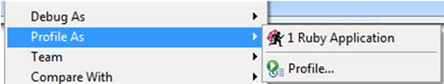
This launches the script under the profiler. The Profiler will gather call graph and CPU timing information for the duration of the run. When the script exits, the profiler generates your results and automatically opens the Profiling perspective.
The Profiling perspective contains two Views to display profiling results: