
This Help topic gives an overview of the Hot Spots View.
Introduction
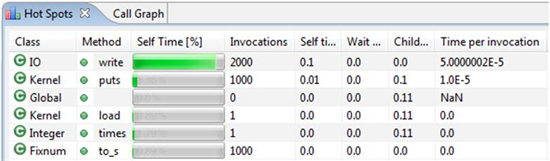
The Hot Spots View is part of the Profiling Perspective that is included in RadRails Pro. The Hot Spots View displays CPU timing information for a Ruby application in a simple sorted table format (shown below).
Instructions
Use the graph in the Hot Spots View to view your CPU data. The view displays the data in a sortable table format. You can sort your data by the following measurements:
- Invocations (call count)
- Self time (default)
- Wait time
- Child time
- Time per invocation.
Click the column headers to sort your data.