
This Help topic gives an overview of the Call Graph View.
Introduction
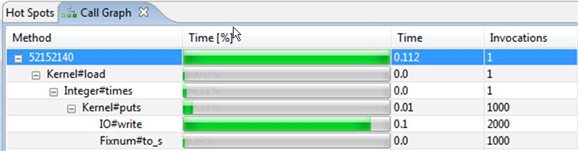
The Call Graph View (shown below) shows timing information in a tree format.
Instructions
Use the Call Graph View to determine step by step of the method chain the timing breakdown. With this view, you can to traverse the call graph from the thread root to determine these steps.
To open a method definition, right-click an entry in the graph and selection Open Method from the context menu.