
This page gives an overview of the Aptana Debug perspective.
Introduction
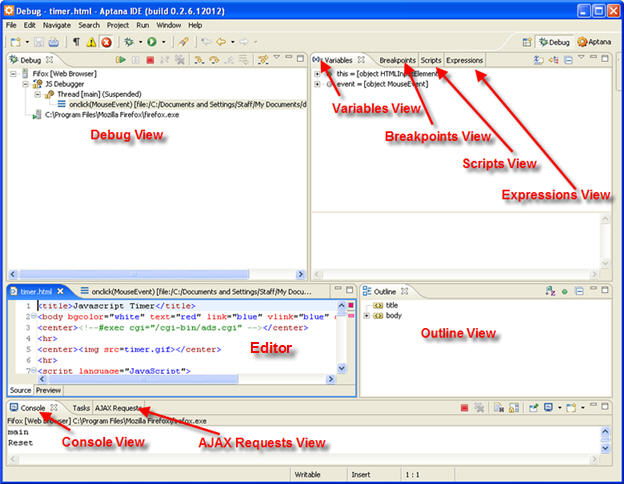
Switch to the Aptana Debug perspective when you want to debug the JavaScript code on one of your web pages. The Debug perspective contains several views that are not found in the Aptana perspective:
- Debug View - The Debug View displays debugging targets and processes that are currently running.
- Variables View - The Variables View shows the scope of variables when the JavaScript thread is suspended.
- Breakpoints View - The Breakpoints View lists the breakpoints for the file that you are debugging.
- Scripts View - The Scripts View displays the scripts that are currently being debugged.
- Expressions View - The Expressions View displays the value of current expressions.
- AJAX Requests View - The AJAX Requests View displays current AJAX requests.
In additon to the above debugging-specific views, you will also have access to some views from the Aptana perspective that you are probably familiar with:
- Editor View - The Editor View displays the file currently being debugged in its appropriate Aptana Editor.
- Outline View - The Outline View displays an outline of the code for the file that is currently being debugged.
- Console View - The Console View displays log output from the debugger.
Instructions
To switch to the Aptana Debug perspective:
- Click the Perspective button
 in the upper-right corner of the workbench.
- Select Other > Debug.
- Click OK.