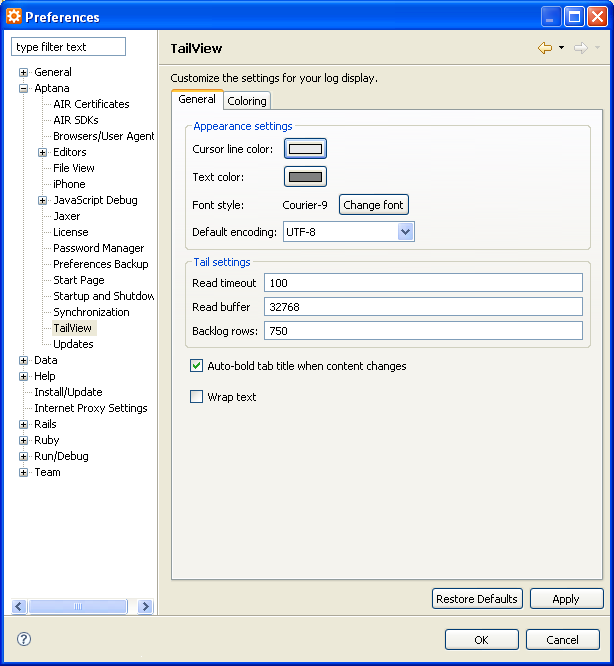
This page gives an overview of the TailView Preference Page.
Contents |
Introduction
Your TailView View monitors log files created by various sources, including the IDE itself. You can configure a number of options to control its refresh rate and the amount of content displayed in the view. These settings can be changed in the TailView Preference Page as described below.
Accessing the TailView Preference Page
In order to change the refresh rate and content size of TailView, you must first access the TailView's Preference Page. You can find that by opening the Preferences page and navigating to Aptana > TailView.

General Preferences
- Cursor line color: Use this option to set the background color of the line where the cursor is currently located
- Text color: Use this option to set the color of text that does not match any rules as defined in the Coloring Preference Page. This is the default text color
- Font style: Use this option to select the font with which to display text in this view.
- Default encoding: Use this option to control the text encoding to be used when reading monitored log files.
- Read timeout: Use this option to control the polling rate used when monitoring log files. This value specifies the number of milliseconds to wait before checking if a monitored log file has changed.
- Read buffer: Use this option to control the amount of text that is read in from a log file when a change occurs in the log file
- Backlog rows: Use this option to control the maximum number of lines to retain in the TailView.
- Auto-bold tabe title when content changes: Use this option to cause a log file's tab to swtich to a bold font when a change has occurred in that log file. This can be used a visual cue that a file has changed even though it may be obscured by other tabs in the view.
- Wrap text: Use this option to wrap long lines of text that extend beyond the right side of the view.
Coloring Preferences
To customize your TailView colorization, click the Coloring tab on the TailView preferences screen.
