
This Help topic gives an overview of the Jaxer Activity Monitor View.
Contents |
Introduction
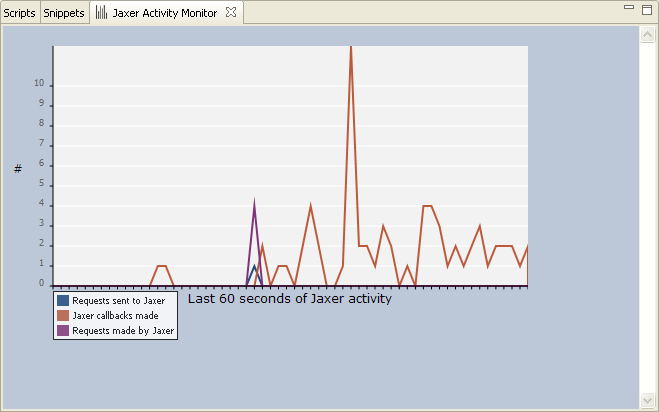
The Jaxer Activity Monitor View (shown below) monitors traffic to your internal Jaxer server. This view shows the last 60 seconds of requests sent to Jaxer, requests made by Jaxer, and Jaxer callbacks made.
Instructions
Displaying the Jaxer Activity Monitor View
To display the Jaxer Activity Monitor View:
- From the Window menu, select Show View > Other... to open a Show View window.
- On the Show View window, expand Aptana Standard Views, and select Jaxer Activity Monitor.
Aptana displays the Jaxer Activity Monitor View. The view automatically displays the last 60 seconds of activity for the internal Jaxer server in a graphical format.
To view the cumulative stats for the internal Jaxer server, go to the Servers
View and click the View Statistics button ![]() .
.