This page describes how to use Firebug to monitor XMLHttpRequests on a web page.
Contents |
Introduction
Firebug provides you with two ways to monitor XMLHttpRequest objects and
other network activity. You can view all types of network activity, including
XMLHttpRequest objects via the ![]() tab. You can also see all XMLHttpRequest messages that have been logged
using the
tab. You can also see all XMLHttpRequest messages that have been logged
using the ![]() tab.
tab.
Instructions
Using the Net tab
To view all network activity:
- In the lower right corner of Firefox, click the Firebug button
 to start Firebug.
- Click the
 tab to view network activity for the page.
- Click one of the buttons above the tab to select what type of network activity
you'd like to view:
- All - View all network activity.
- HTML - View HTML files loaded into the page.
- CSS - View all CSS files loaded into the page.
- JS - View all JavaScript files loaded into the page.
- XHR - View all XMLHttpRequest objects for the page.
- Images - View all image files loaed into the page.
- Flash - View all Flash (swf) files loaded into the page.
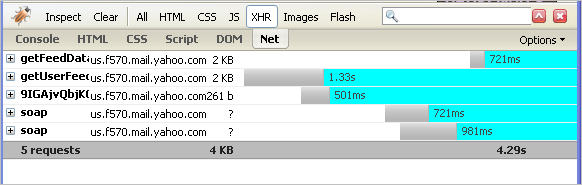
The Net tab displays all specified activity on the page as files and objects are loaded. An animated timeline helps you visually see when things are loaded.
The image below shows example output for XMLHttpRequest objects:
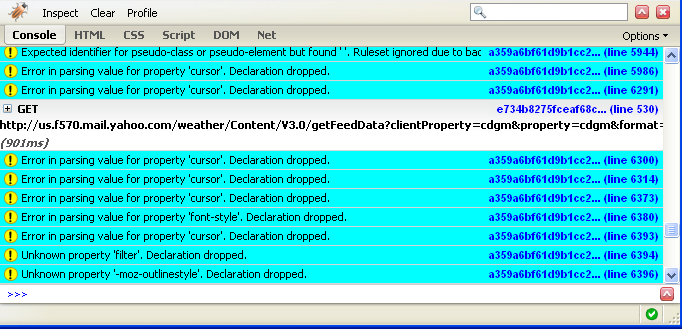
Using the Console
To view XMLHttpRequest messages in the console:
- In the lower right corner of Firefox, click the Firebug button to start Firebug.
- Click the
 tab to view console messages the page.
Any XMLHttpRequest messages for the page will be displayed in the console (see example below).