
This page describes how to add a breakpoint to your JavaScript code for the Aptana JavaScript debugger.
Contents |
Introduction
Add a breakpoint to your JavaScript code to stop the execution of your script at that exact point. Using breakpoints can help you determine the current value or type of a variable at that moment, and other useful information.
You can either manually add a breakpoint to your code, or you can add an exception breakpoint to your code.
Instructions
Manually adding a breakpoint to your code
To manually add a breakpoint to your JavaScript code:
- Start the debugger and switch to the Aptana Debug perspective. (See Running the debugger if you need help.)
- Suspend the current JavaScript thread.
- In the Debug View, select the thread that you want to suspend.
- Click the Suspend button
 to suspend the JavaScript code on the first executed line. While the thread
is suspended, your web browser user interface will be completely disabled.
to suspend the JavaScript code on the first executed line. While the thread
is suspended, your web browser user interface will be completely disabled.
- Add a breakpoint to your code.
- In the Editor or Outline View, navigate to the point in your code where you want to add a breakpoint.
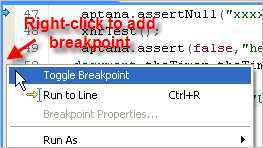
- In the gray left margin of the Editor, right-click and select Toggle Breakpoint from the context menu (shown below).
- Click the Resume button
 to resume the execution of your code. Your code will be suspended again
when execution hits the breakpoint that you set up.
to resume the execution of your code. Your code will be suspended again
when execution hits the breakpoint that you set up.
Adding an exception breakpoint to your code
To add a breakpoint to your code so that execution automatically breaks on a certain type of exception:
- Open the file with your script in the appropriate Editor.
- From the Run menu, select Add JavaScript Exception Breakpoint... to open an Add JavaScript Exception Breakpoint pop-up window.
- On the Add JavaScript Exception Breakpoint pop-up window, select the type of exception that you would like to break on.
- Run the debugger (see Running the debugger) to debug your code.